





People measure what is easy to measure
Almost every agency looks at numbers. Very few look at ones that trigger a decision, and that is exactly the difference between a report and a dashboard.
The OnlyFans CRM dashboard shows the metrics from this article per creator and per chatter.
The reason is mundane: what gets measured is whatever is already there. Monthly revenue is sitting there anyway, so is the subscriber count, and messages sent can be counted. So those three get looked at. The problem is not that they are wrong, they are simply outcomes rather than causes. They tell you a month was worse, never why.
The usable test for any metric is: which decision do you make differently when this number changes? If there is no answer, it is decoration. By that rule, not much of the usual overview survives, and what does is quite small.
The three numbers that reliably mislead
All three sit at the top of almost every report, and all three mislead when read without a reference point.
Total revenue per chatter
The most widespread mismeasurement there is. Whoever has the weekend evening shift ends up on top, not because they write better, but because more people are online then. This number rewards shift luck and punishes the night shift. It only becomes comparable per hour, and only meaningful together with the buy rate; both are covered in detail in Paying chatters.
Number of messages sent
It sounds like diligence and measures activity rather than effect. Anyone making this number a target gets exactly that: more messages, shorter messages, more mass sending, and consequently fewer replies. As a control figure alongside the buy rate it is useful. On its own it is an incentive pointing the wrong way.
Number of subscribers
The number quoted most often in conversation and saying the least. Two hundred subscribers of whom fifteen pay are worth less than eighty of whom thirty pay. It only becomes interesting as a ratio: how many of them bought anything at all last month.
As soon as your team knows what you look at, they work towards it. That is not misbehaviour, it is the predictable response. So in choosing your metrics you decide not only what you see, but also what happens.
Four numbers with a decision attached
These four pass the test from the first section: if one moves, a concrete action follows. A dashboard needs no more than that.
Buy rate per chatter → a staffing decision
How many of the fans written to actually buy. It is independent of volume and shift slot, and therefore the only fair basis for deciding who trains others, who gets trained, and who does not stay. If it drops noticeably for one person, you read conversations, not totals.
Paying fans per channel → a marketing decision
The only number that tells you which traffic channel to keep and which to drop. Without it you decide on feeling and usually keep the one with the biggest numbers rather than the one with the best fans. Why that is the most expensive blind spot is covered in OnlyFans outreach.
Response time in the weakest shift → a planning decision
Not the daily average, which always looks fine. The longest wait in the weakest window tells you whether your shift plan holds or only exists on paper. If it rises, what you need is not a reminder but one more person in that window.
Fans with no purchase in four weeks → a retention decision
The only one of the four showing something that is not happening, and therefore the one that stays invisible without a system. It is a worklist, not a report: whoever is on it gets contacted before they are gone entirely. Which signals come beforehand is covered in Why fans stop paying.
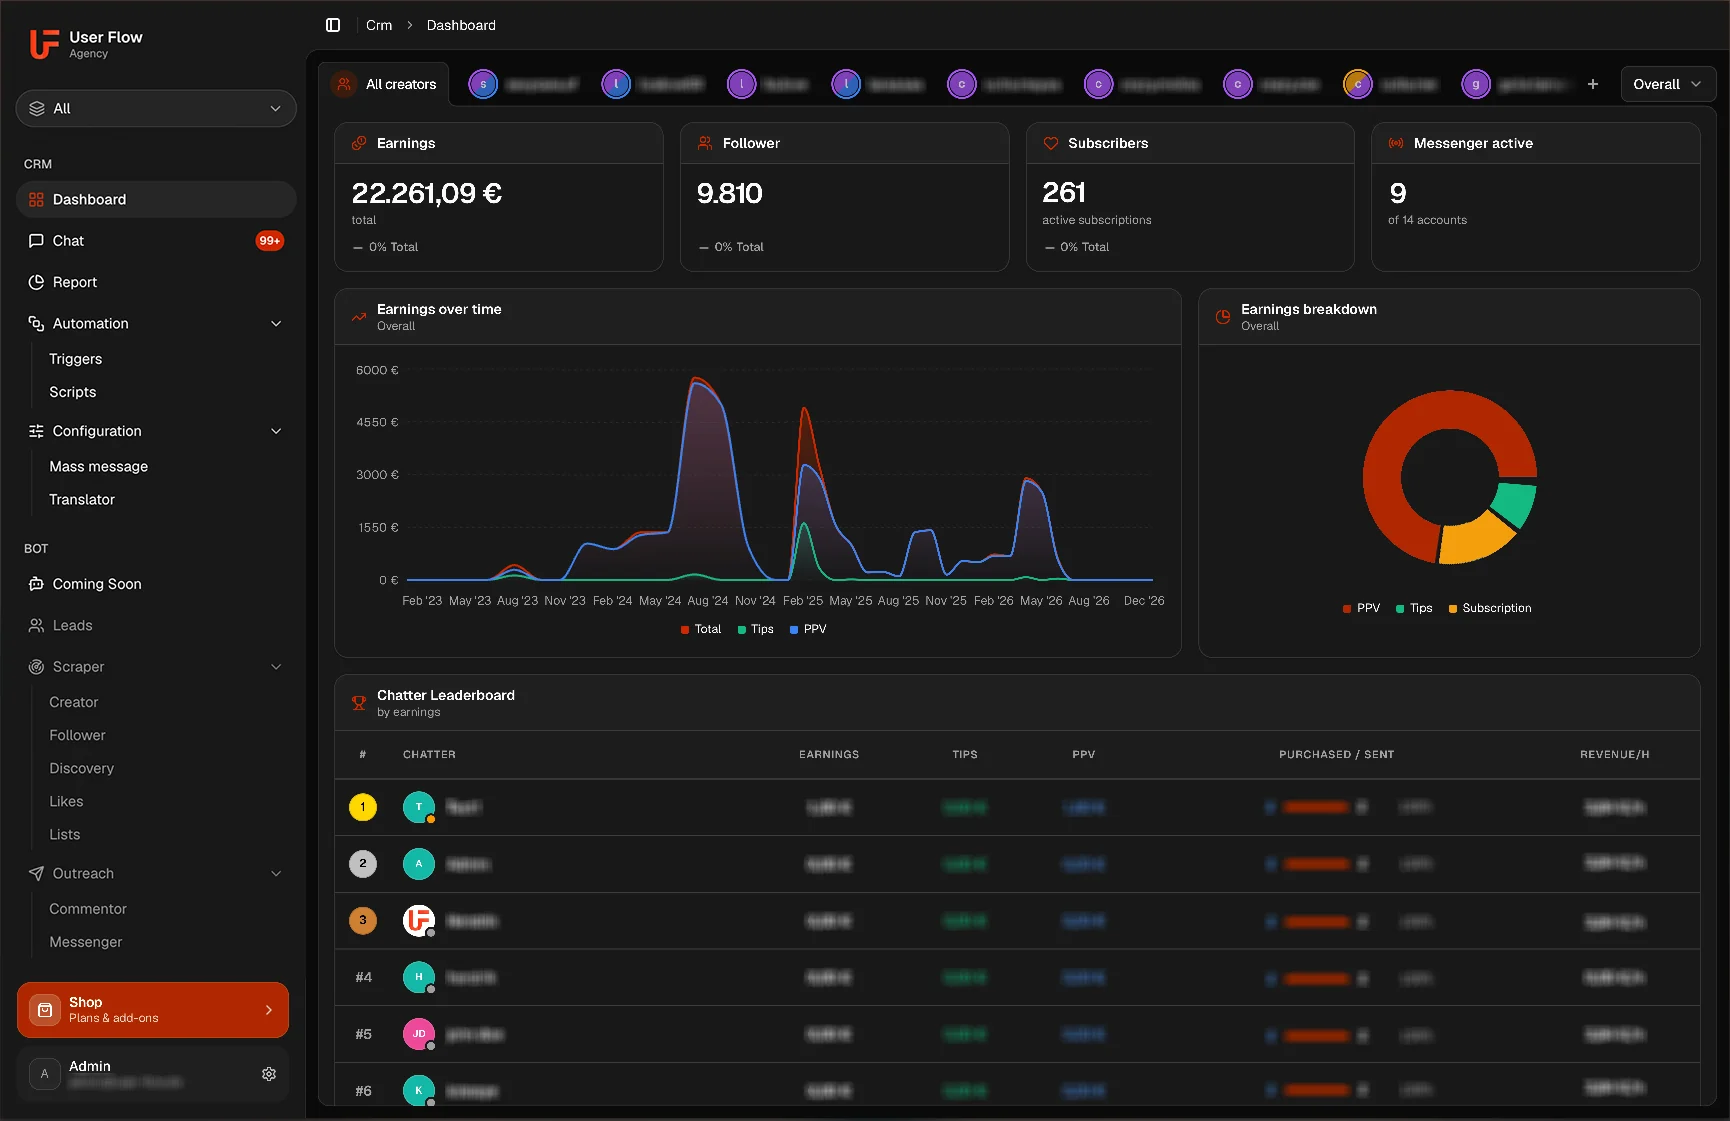
Two views, not one
A common design mistake is putting everything into a single view. Agencies need two, and they answer different questions.
The per-creator view answers: is this account running the way it should? That is where the account's numbers belong, compared with the previous month, not with other creators. Two accounts are practically never comparable, because niche, reach and price differ. Putting them side by side anyway produces false conclusions and demotivates the smaller creator along the way.
The view across all creators answers something else: where is my team currently misallocated? Here it does not matter who does the most, but where attention is missing, which account has the worst response time, which has had no new paying fans for weeks, which chatter stands out across several accounts.
That second view is the actual reason for having a system. As long as you have to switch between files to assemble it, it effectively does not exist, and the decisions attached to it get made on gut feeling.
How often to look
The second design mistake is the wrong rhythm. Looking too often produces busywork, looking too rarely lets problems grow, and both look like diligence from the outside.
Daily belongs exactly one thing: unanswered messages. That is a queue, not a metric. Everything else fluctuates too much over a day to draw anything from it.
Weekly fits buy rate per chatter and response time in the fringe hours. A week is long enough for randomness to average out and short enough to still change something.
Monthly belongs the channel analysis and the per-creator comparison with the previous month. Channels need that distance, because a single good post distorts a week.
Never as a running figure: total revenue. It is the sum of everything above and changes nothing about what you do that the four numbers had not already told you.
What that requires
Three of those four numbers do not appear by themselves. Buy rate per chatter requires messages to be attributed to a person. The channel analysis requires the origin to have been recorded on the fan. The list of quiet fans requires somebody to know the date of the last purchase.
That is the practical reason this reporting does not work with a spreadsheet and a group chat, not because spreadsheets are bad, but because the data for it never gets captured. When the switch is due is covered in OnlyFans CRM.
Four numbers that trigger a decision.
CRM and translator for OnlyFans: buy rate per chatter, fan history beside the conversation and every creator in one view instead of a file per account. The bot runs on Maloum and 4Based. Everything is €0 during the beta.
Frequently asked questions
Which metrics should an OnlyFans agency track?
Four are enough, and each has a decision attached: buy rate per chatter for staffing, paying fans per channel for marketing, response time in the weakest shift for planning, and fans with no purchase in four weeks for retention. The test for any further number is: which decision do you make differently when it changes?
Why is revenue per chatter misleading?
Because it mostly measures the shift slot. Whoever has the weekend evening shift comes out on top, not because they write better, but because more people are online then. The number rewards shift luck and punishes the night shift. It only becomes comparable per hour and only meaningful together with the buy rate.
Should you measure the number of messages sent?
Only as a control figure alongside the buy rate, never as a target. Making it a target gets you more and shorter messages, more mass sending and consequently fewer replies. Every metric is an incentive: as soon as the team knows what you look at, they work towards it.
How often should I look at the numbers?
Daily belongs exactly one thing, unanswered messages, and that is a queue rather than a metric. Weekly fits buy rate per chatter and response time in the fringe hours. Monthly belongs the channel analysis and the per-creator comparison with the previous month. Total revenue belongs in none of those rhythms.
Should I compare creators with each other?
No. Two accounts are practically never comparable, because niche, reach and price differ, a comparison produces false conclusions and demotivates the smaller creator. Compare a creator with their own previous month. The view across all creators serves a different question: where your team is currently misallocated.
Why does this not work with a spreadsheet?
Because three of the four numbers do not appear by themselves. Buy rate per chatter requires messages attributed to a person; the channel analysis requires the origin recorded on the fan; the list of quiet fans requires the date of the last purchase. The problem is not spreadsheets but that this data never gets captured along the way.